
ICSE Class 9 Physics • Chapter 4 • Comprehensive Chapter Notes
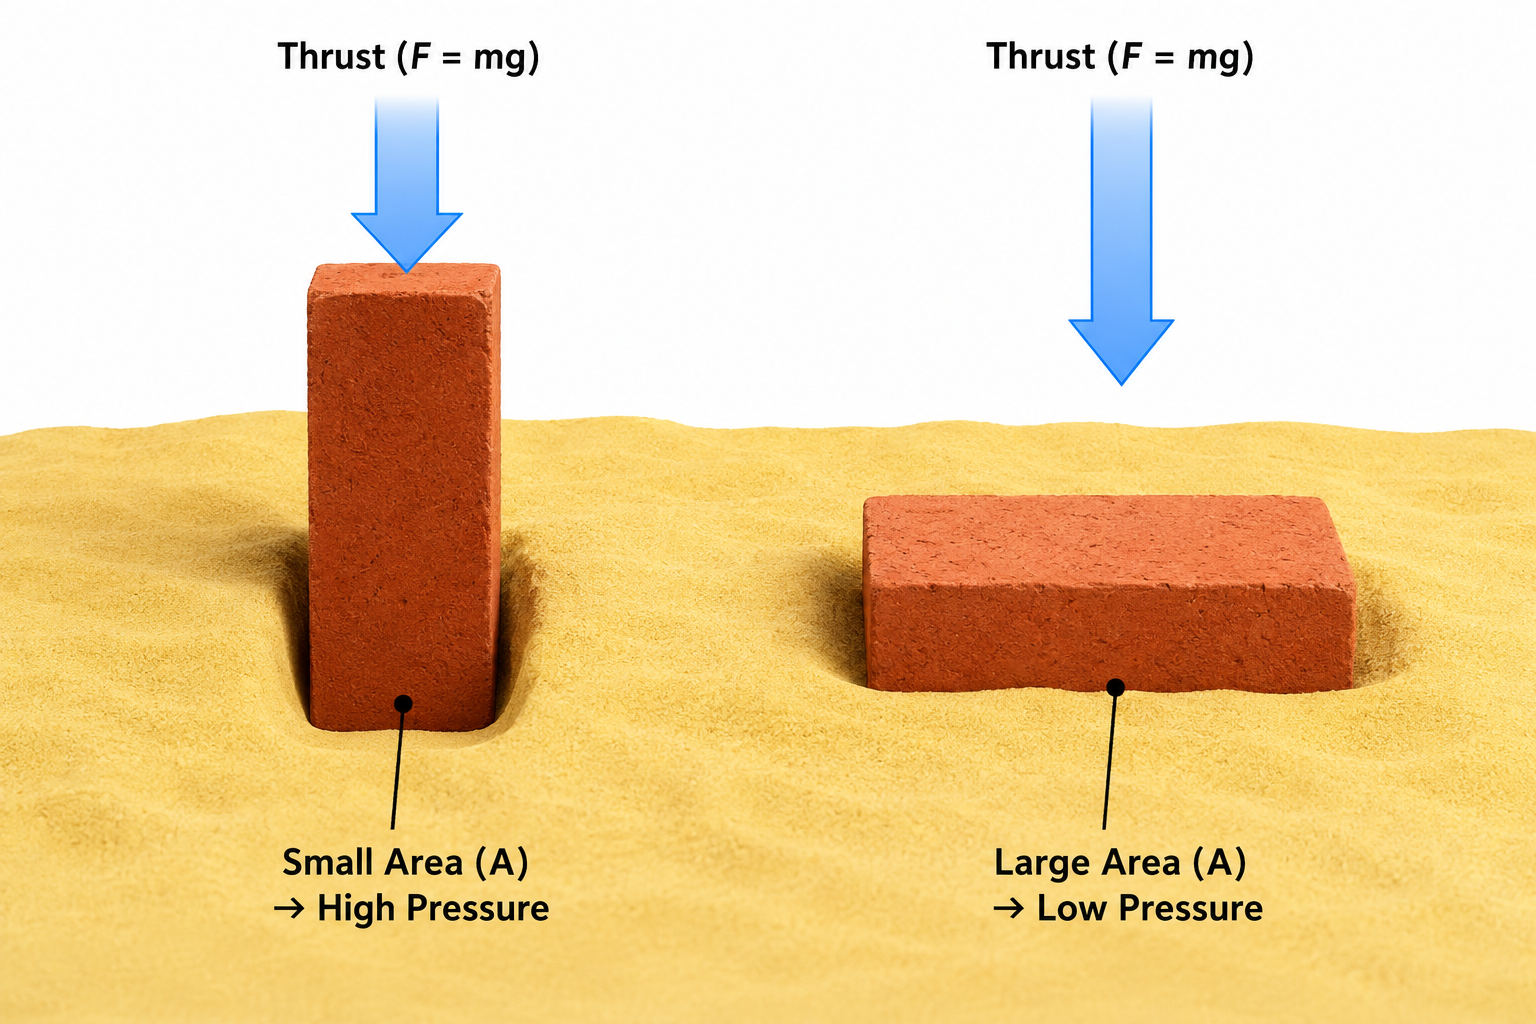
Diagram Description: A highly professional, 3D landscape academic diagram on a pure white (#ffffff) background. Show two identical rectangular red bricks resting on a bed of smooth yellow sand. The left brick is standing vertically on its smallest face, sinking deeply into the sand. The right brick is lying horizontally on its largest face, sinking only slightly. Two identical downward-pointing transparent blue arrows sit above each brick, indicating equal thrust. Clean shapes. IMPORTANT: You must include crisp, professional mathematical text labels and vector arrows. Label the downward arrows as "Thrust (F = mg)". Label the small base area as "Small Area (A) -> High Pressure" and the large base area as "Large Area (A) -> Low Pressure". Keep it strictly academic.
Thrust: A force can be applied on a surface in any direction. If a force is applied in a direction normal (or perpendicular) to the surface, it is called the thrust.
Pressure: The effect of thrust depends on the area of the surface on which it acts. The effect of a thrust is less on a large area, while it is more on a small area. Pressure is defined as the thrust per unit area of a surface.
Units of Pressure:
Factors affecting the pressure: The pressure exerted on a surface depends directly on the thrust and inversely on the area on which it acts.
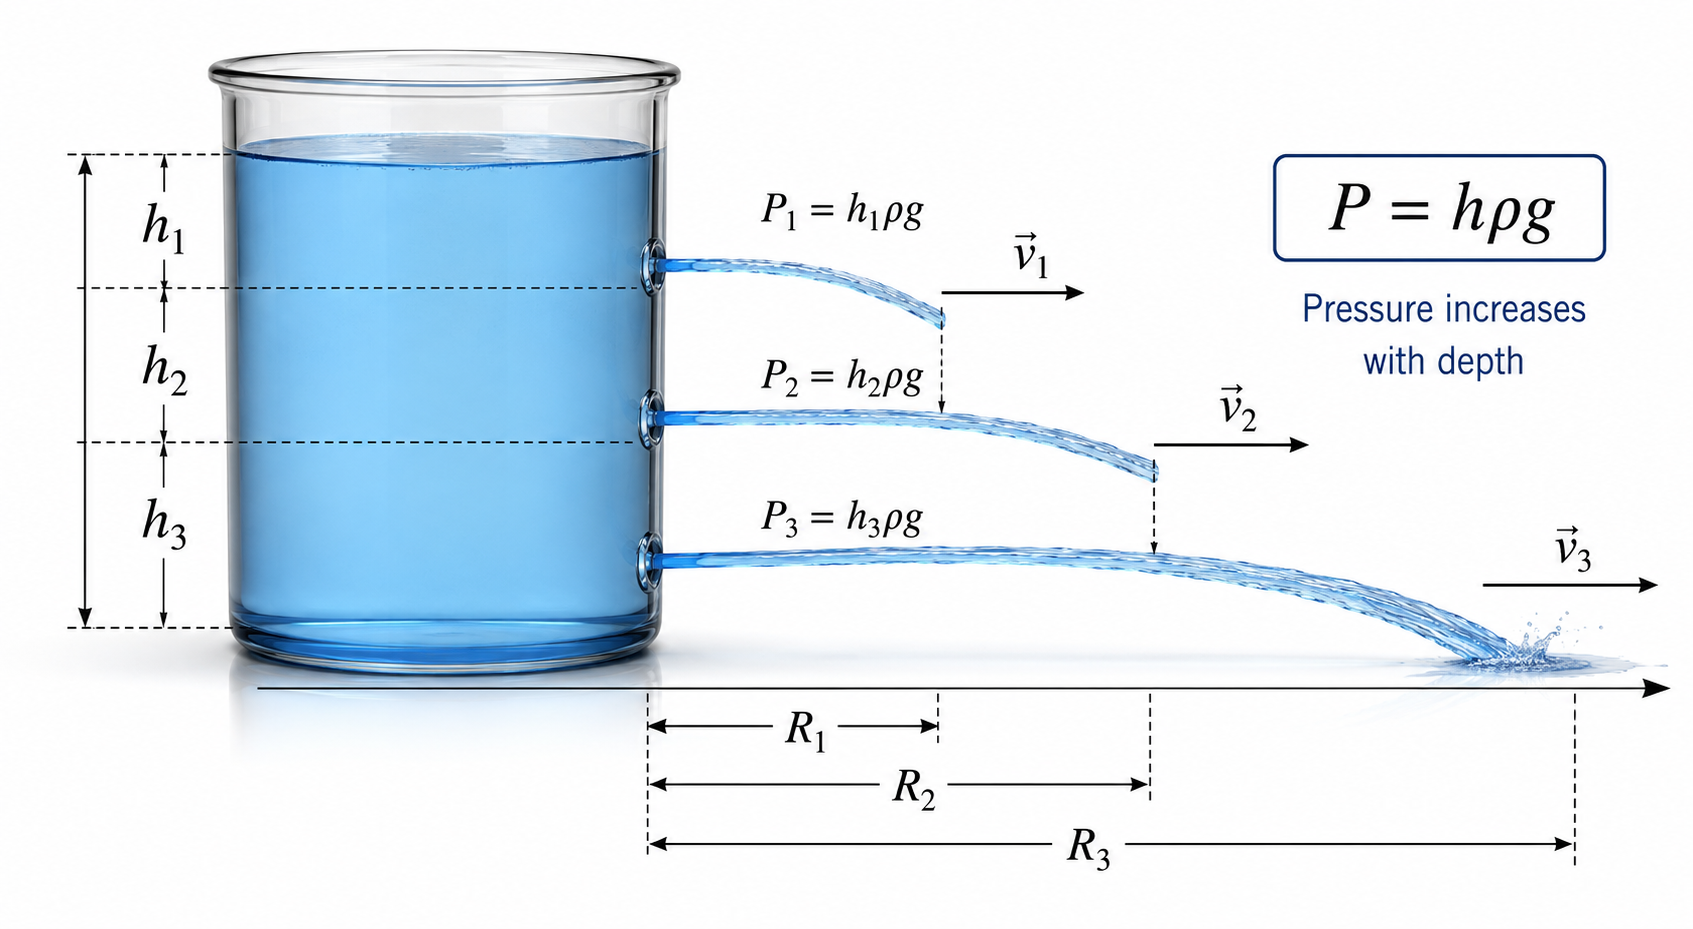
Diagram Description: A highly professional, 3D landscape academic diagram on a pure white (#ffffff) background. A transparent glass beaker filled with blue liquid. Three small circular holes are drilled vertically on the right side of the beaker at different depths (shallow, middle, deep). Blue water jets spurt out from all three holes simultaneously. The jet from the deepest hole shoots out the furthest horizontally along the surface, while the shallowest jet falls closest to the base. Clean shapes. IMPORTANT: You must include professional mathematical text labels. Label the depths as "h₁", "h₂", and "h₃". Add text "P = hρg" to show pressure increases with depth. Add horizontal vector arrows indicating the water jets' velocity.
A substance which can flow is called a fluid. All liquids and gases are fluids. A solid exerts pressure only on the surface on which it is placed (at its bottom). However, a fluid exerts pressure on the bottom as well as on the walls of the container due to its tendency to flow. Thus, a fluid contained in a vessel exerts pressure at all points and in all directions.
Experimental Demonstration: Take a vessel filled with water and make several small holes in the wall. You will observe:
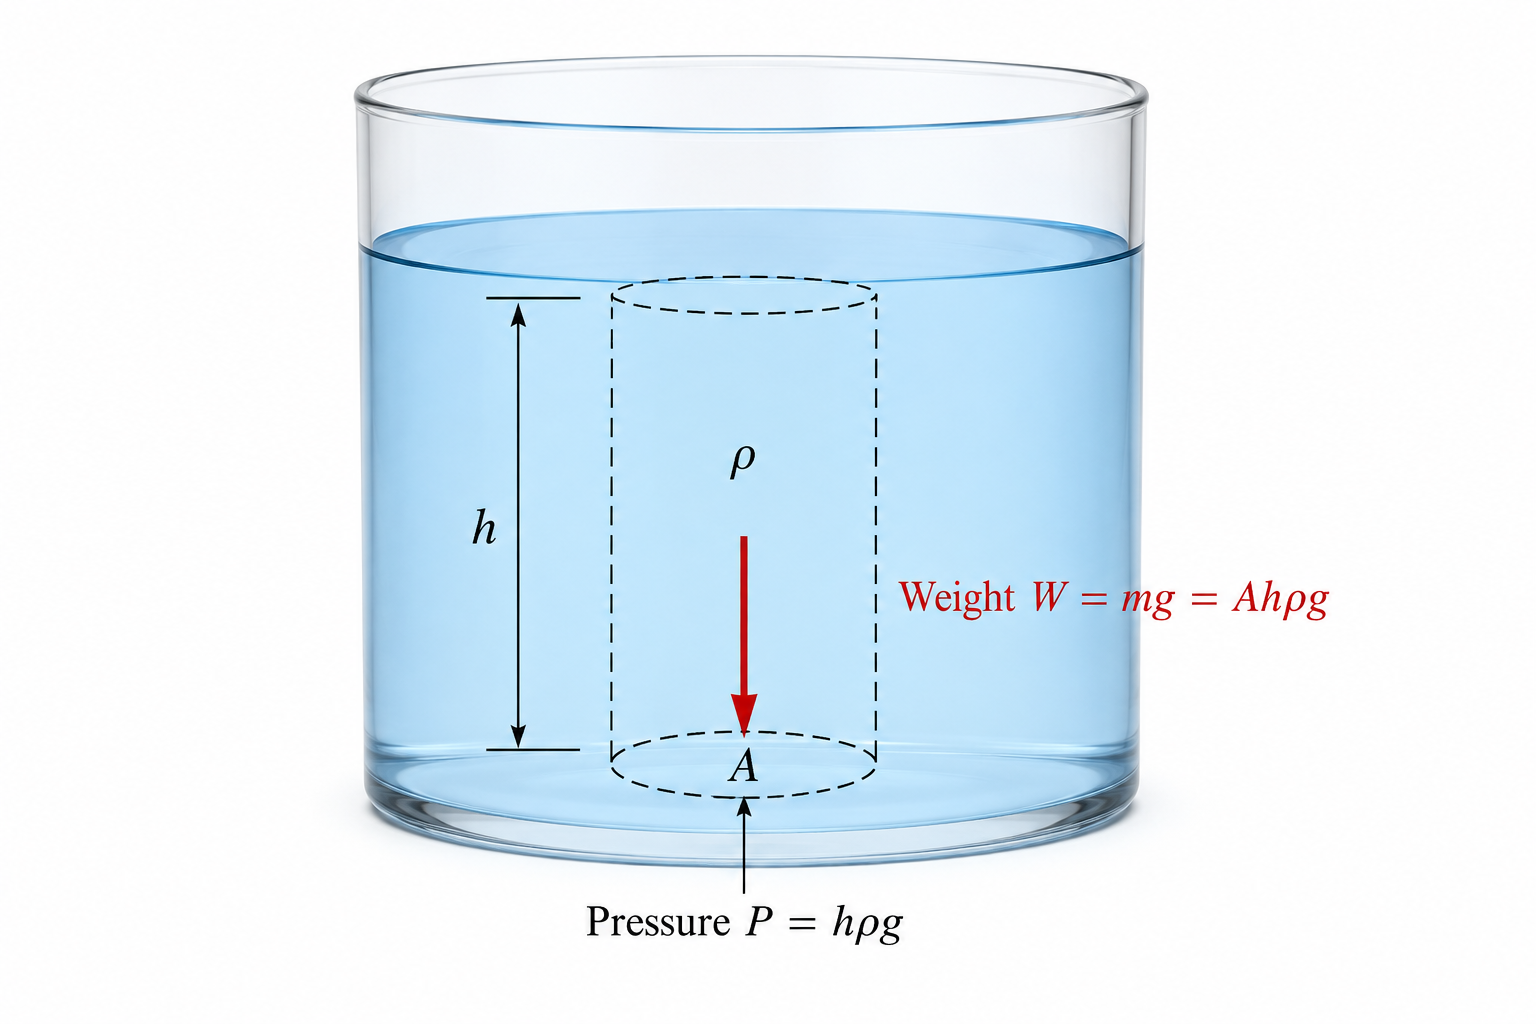
Diagram Description: A highly professional, 3D landscape academic diagram on a pure white (#ffffff) background. A cylindrical glass vessel filled with light blue fluid. Inside the fluid, a highlighted imaginary cylindrical column of the fluid is outlined in sleek dashed lines. A distinct red downward arrow indicates the weight of this imaginary column pressing down on its circular base. Minimalistic, strictly academic. IMPORTANT: You must include crisp mathematical text labels. Label the height as "h", the base area as "A", and the fluid density as "ρ". Label the red downward vector arrow as "Weight W = mg = Ahρg". Add a label at the base: "Pressure P = hρg". Do not clutter.
Consider a vessel containing a liquid of density $\rho$. To calculate pressure at depth $h$, consider a horizontal circular surface PQ of area $A$ at depth $h$ below the free surface. The pressure is due to the weight of the liquid column above PQ.
$$ \text{Thrust} = \text{Volume} \times \text{density} \times g = (A \times h) \times \rho \times g = Ah\rho g $$ $$ P = \frac{\text{Thrust}}{\text{Area}} = \frac{Ah\rho g}{A} = h\rho g $$Total pressure at depth $h$ (including atmospheric pressure $P_0$):
$$ \text{Total Pressure} = P_0 + h\rho g $$Factors affecting pressure at a point in a liquid:
Note: Pressure does NOT depend on the shape and size of the vessel, or the area of surface on which it acts.
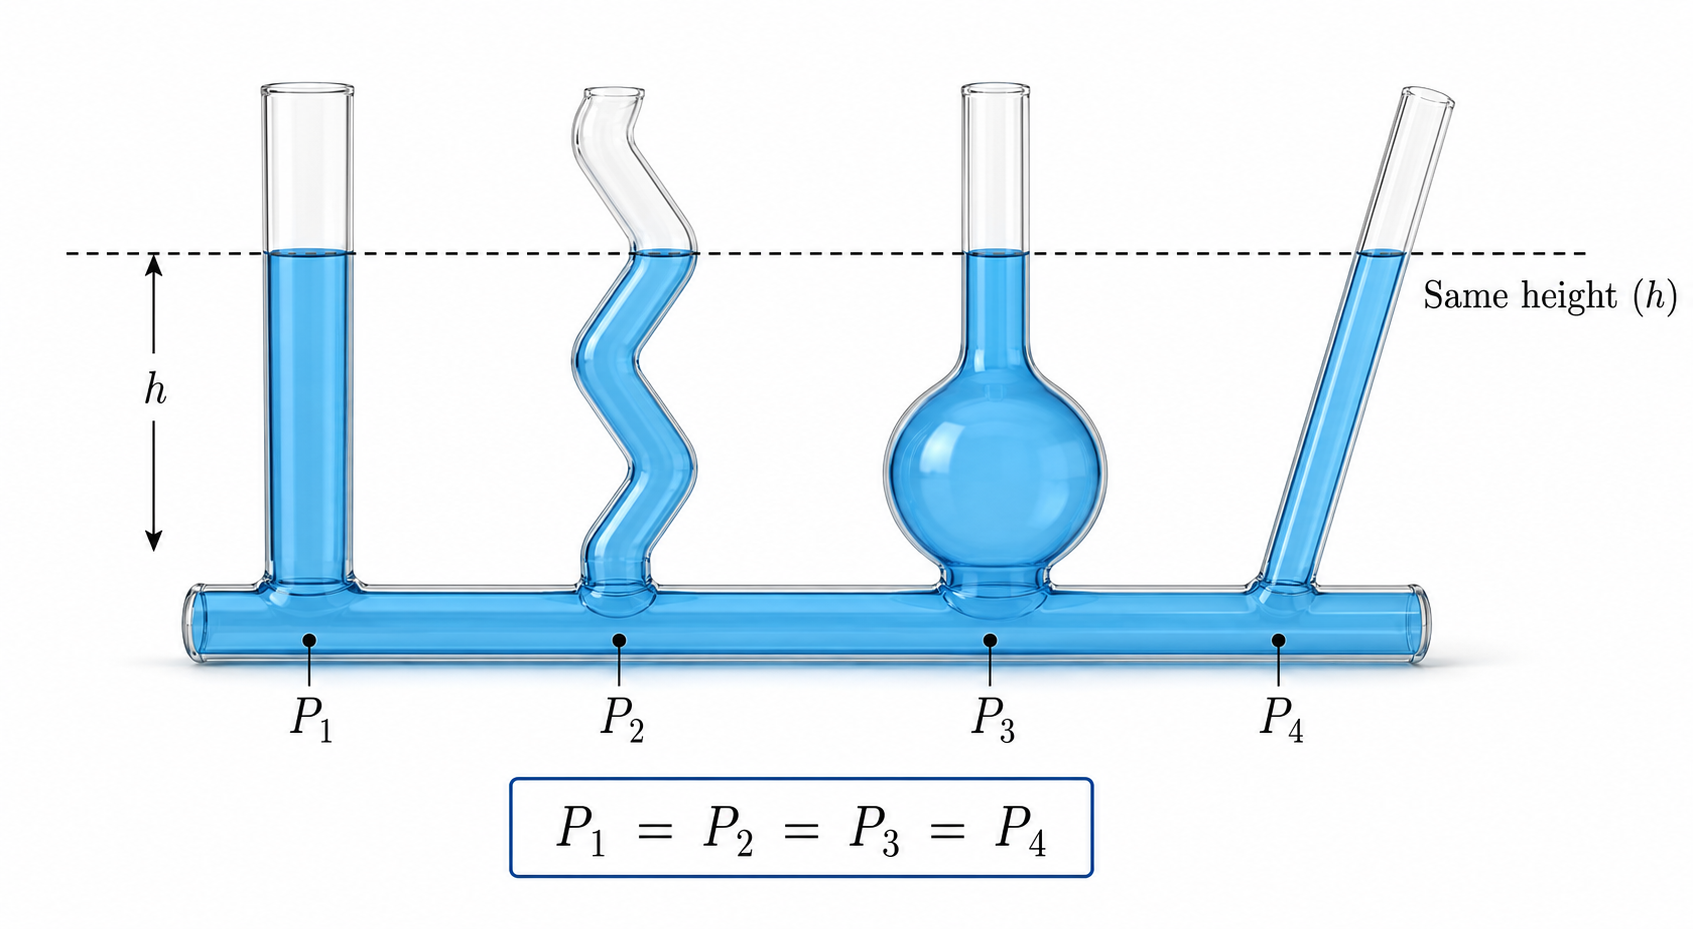
Diagram Description: A highly professional, 3D landscape academic diagram on a pure white (#ffffff) background. A 'communicating vessels' apparatus consisting of a single horizontal base tube connecting four vertical glass tubes of completely different shapes (one straight cylinder, one zigzag, one bulbous flask, one slanted tube). All tubes are filled with blue liquid. The free surface level of the liquid is at the exact same horizontal height across all the differently shaped tubes, demonstrating that liquid seeks its own level. Minimalist and clean. IMPORTANT: You must include professional mathematical text labels. Add a horizontal dashed line labeled "Same height (h)". Add labels "P₁", "P₂", "P₃", "P₄" at the bottom of each tube, and an equation "P₁ = P₂ = P₃ = P₄" to show equal pressure at the same depth.
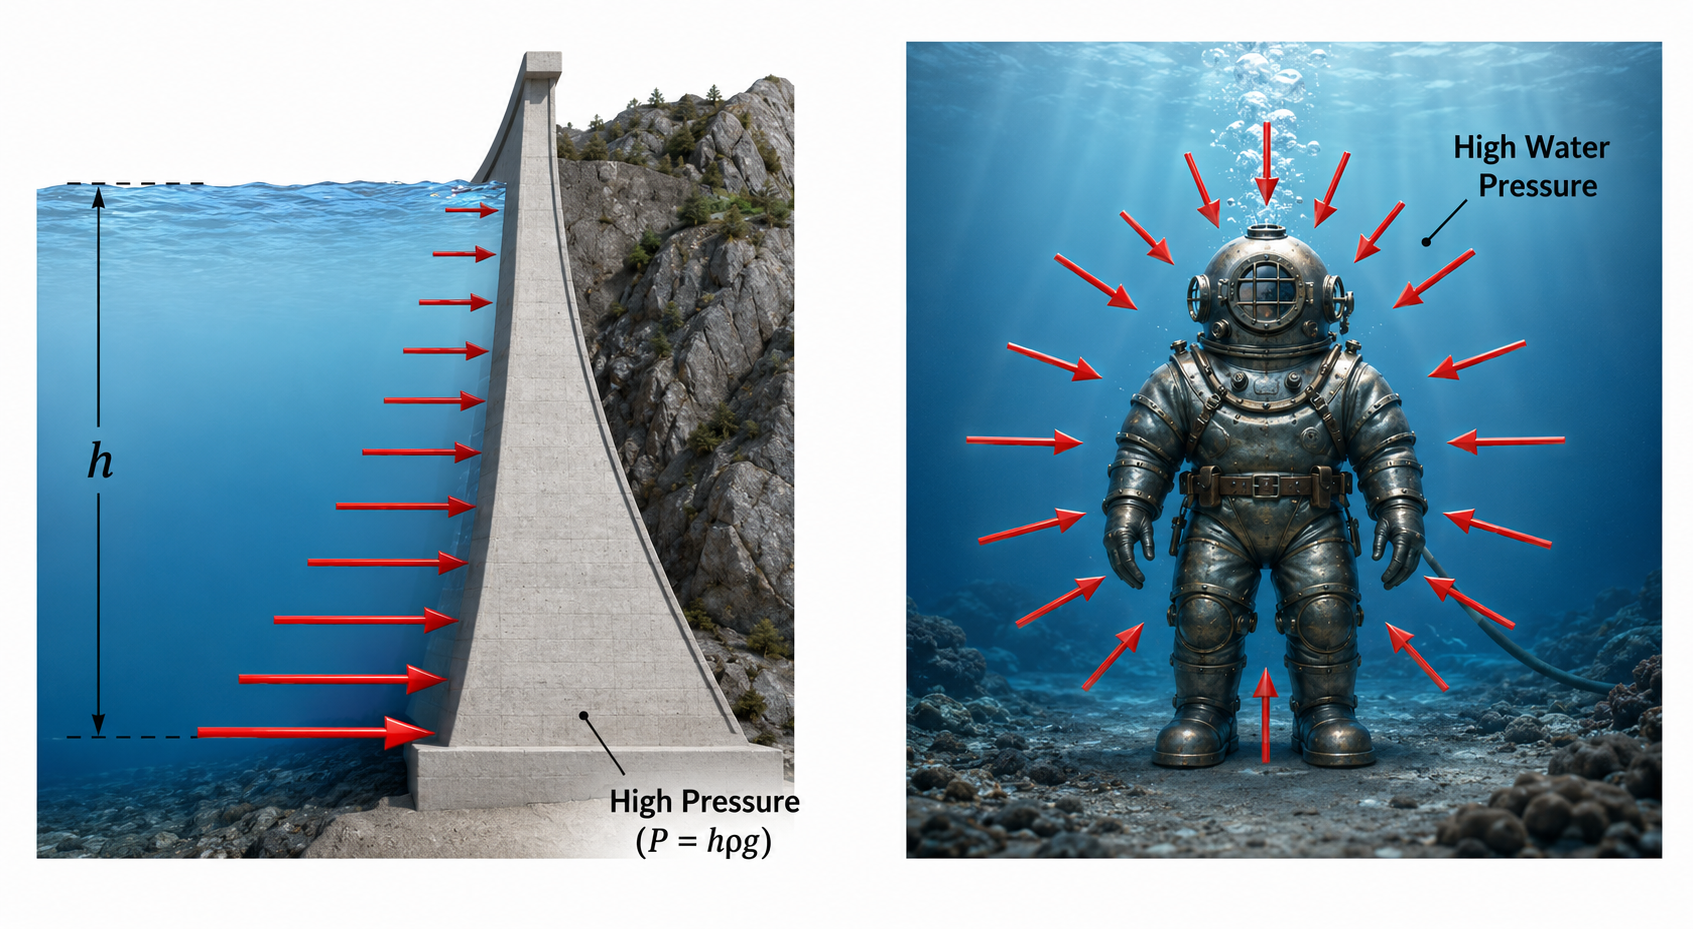
Diagram Description: A highly professional, 3D landscape academic diagram on a pure white (#ffffff) background. A split-panel view. Left panel: A cross-section of a massive concrete water dam holding a vast body of blue water. The concrete dam wall is thin at the top and slopes outward to become extremely thick at the base. Graduated red horizontal arrows point from the water toward the dam, getting longer near the bottom. Right panel: A deep-sea diver in a heavy vintage metallic protective suit submerged deep underwater, with arrows pointing inward towards the suit from all directions indicating high pressure. No text clutter, but MUST include professional labels. Left panel: label the depth as "h" and add text "High Pressure (P = hρg)" near the thick bottom base. Right panel: label the inward arrows as "High Water Pressure" showing force vectors acting uniformly from all directions.
Q. Calculate the pressure due to a water column of height 100 m. (Take $g = 10 \text{ m s}^{-2}$ and density of water $= 10^3 \text{ kg m}^{-3}$).
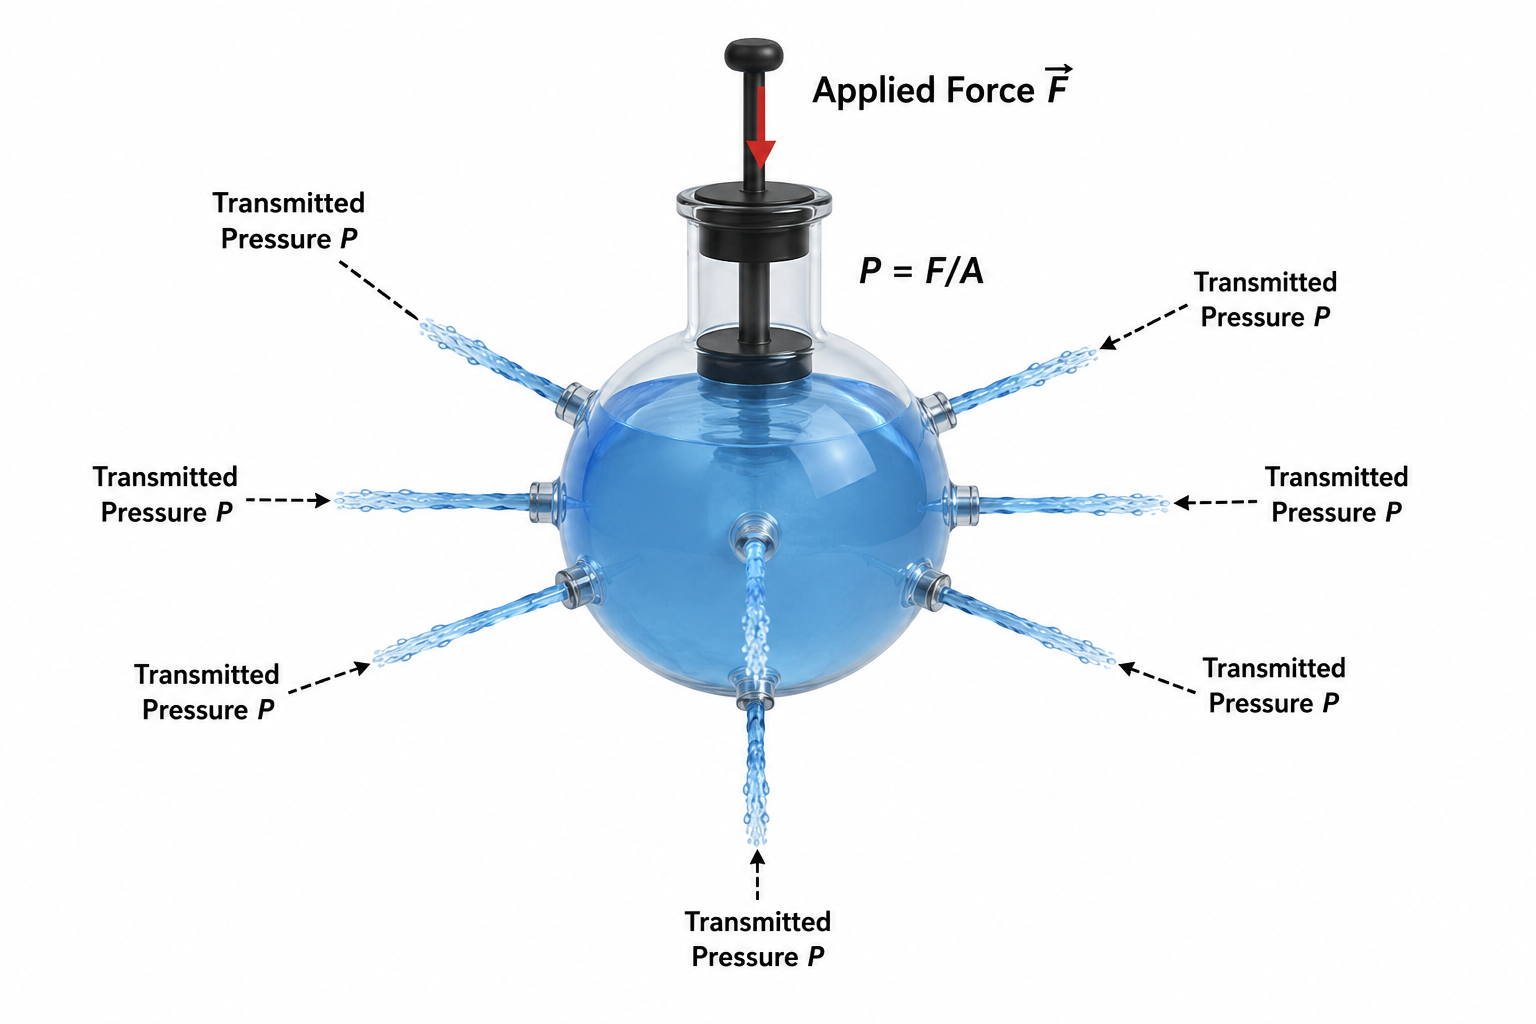
Diagram Description: A highly professional, 3D landscape academic diagram on a pure white (#ffffff) background. A spherical glass flask is filled with blue water, featuring a top opening fitted with a black plunger, and multiple narrow glass nozzles protruding outward in all directions from the bulb. As the plunger is shown pushing down, identical jets of water spurt equally from every single nozzle, reaching the exact same distance, demonstrating equal transmission of pressure. Clean, minimalistic, strictly academic. IMPORTANT: You must include professional mathematical text labels. Label the plunger's downward force with a vector arrow and text "Applied Force F". Add text "P = F/A". Label the exiting jets with "Transmitted Pressure P" to clearly show equal transmission in all directions.
Pascal's Law states: The pressure exerted anywhere in a confined liquid is transmitted equally and undiminished in all directions throughout the liquid.
Demonstration: If a glass flask with narrow tubes on its sides is filled with water and fitted with a piston, pushing the piston down causes jets of water to spurt out from all tubes to the same height, showing equal transmission of pressure.
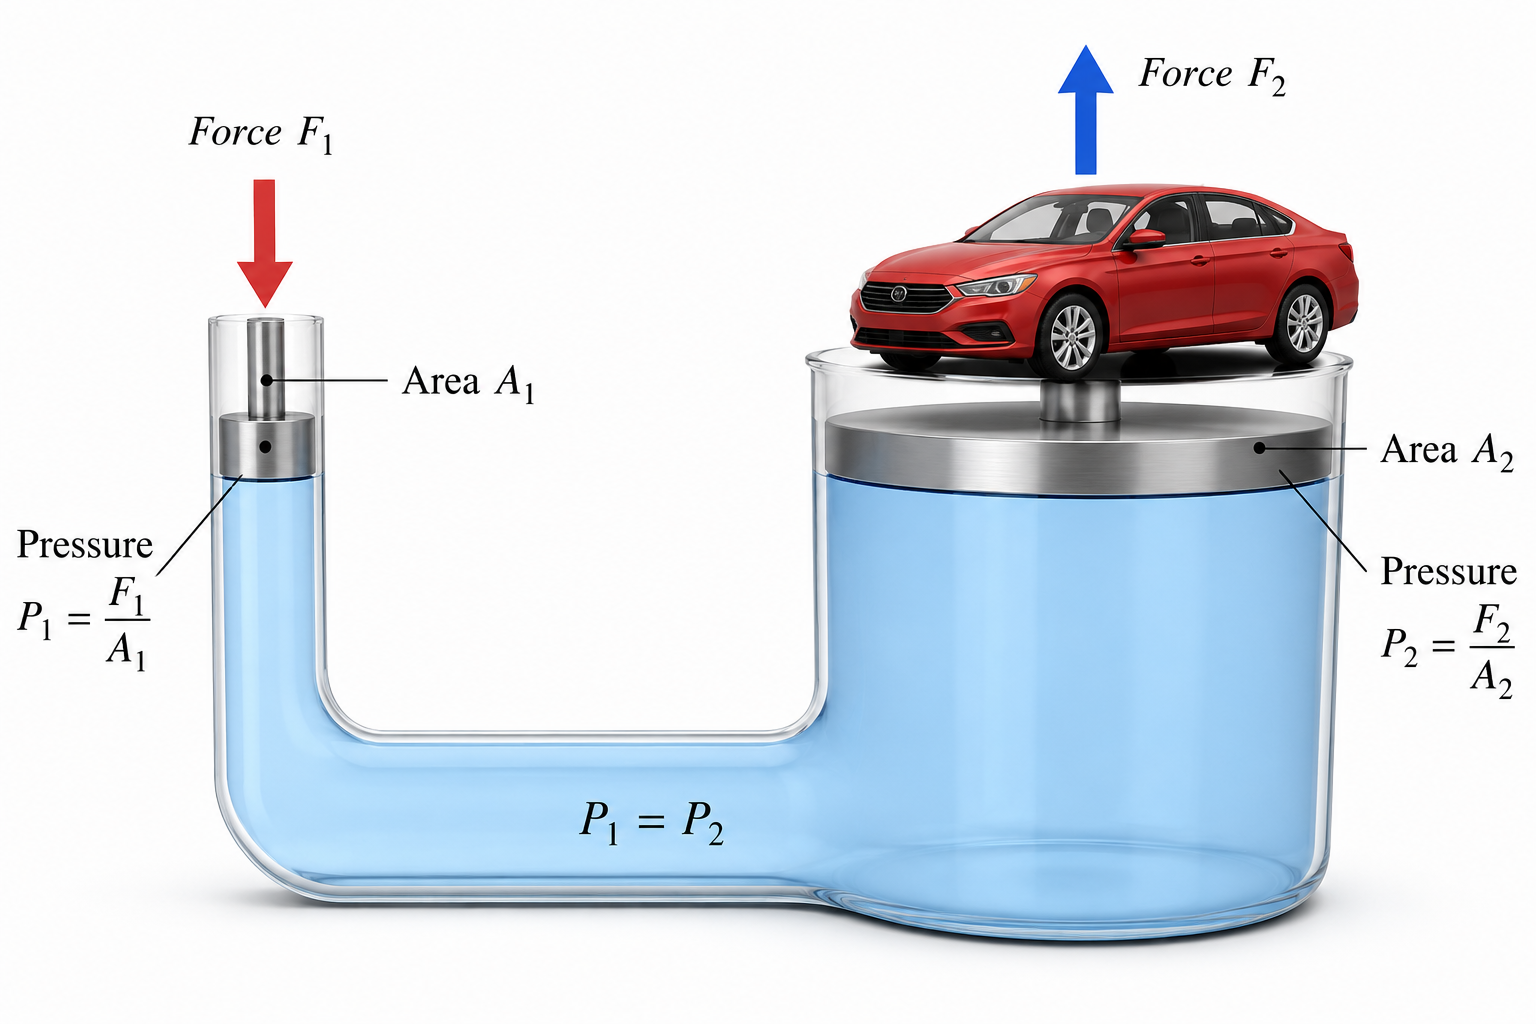
Diagram Description: A highly professional, 3D landscape academic diagram on a pure white (#ffffff) background. A connected U-shaped hydraulic system filled with light blue fluid. The left side is a very narrow vertical cylinder containing a small metallic piston being pushed down by a small red arrow. The right side is a very wide vertical cylinder containing a large metallic piston that is lifting a heavy red automobile upward. Minimalistic, precise physics visualization. IMPORTANT: You must include professional mathematical text labels. Label the small piston: "Area A₁", "Force F₁", and "Pressure P₁ = F₁/A₁". Label the large piston: "Area A₂", "Force F₂", and "Pressure P₂ = F₂/A₂". Add an equation label "P₁ = P₂" in the fluid.
Hydraulic machines such as the hydraulic press, hydraulic jack, and hydraulic brakes are based on Pascal's law.
A small force applied on a smaller piston is transmitted to produce a large force on a bigger piston.
Pressure on small piston (A): $P_1 = \frac{F_1}{A_1}$
Pressure on large piston (B): $P_2 = \frac{F_2}{A_2}$
By Pascal's Law: $P_1 = P_2 \implies \frac{F_1}{A_1} = \frac{F_2}{A_2}$
$$ \frac{F_2}{F_1} = \frac{A_2}{A_1} $$Since $A_2 > A_1$, then $F_2 > F_1$. The machine acts as a force multiplier.
Q. In a hydraulic machine, the two pistons are of area of cross section in the ratio 1:10. What force is needed on the narrow piston to overcome a force of 100 N on the wider piston?
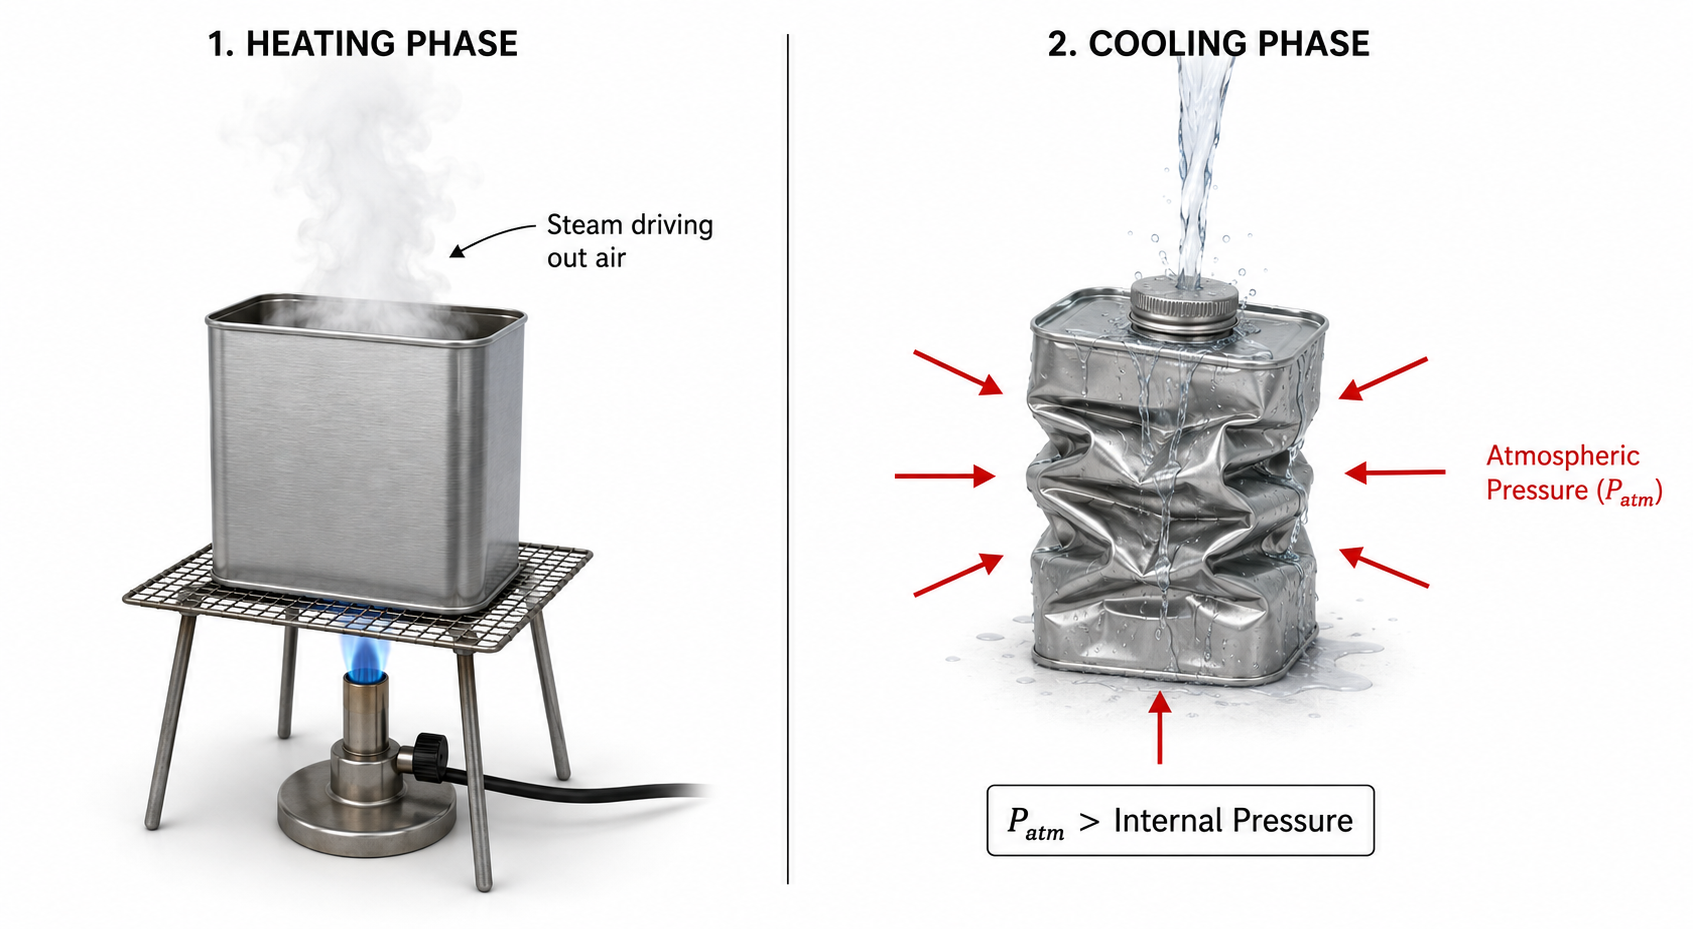
Diagram Description: A highly professional, 3D landscape academic diagram on a pure white (#ffffff) background. A split panel showing two phases of the collapsing tin can experiment. Left side: An open rectangular tin can heated over a bunsen burner, with steam actively exiting the top. Right side: The exact same tin can is now sealed with a cap and removed from the heat; cold water is pouring over it, and the can is visibly violently crumpled and crushed inward. Red arrows point inwards from all sides of the crushed can, representing atmospheric pressure. Clean. IMPORTANT: You must include professional text labels. Left side: label the steam with "Steam driving out air". Right side: label the inward red arrows as "Atmospheric Pressure (P_atm)" and add text "P_atm > Internal Pressure" to explicitly explain the crushing force.
Atmospheric Pressure: The envelope of air around the earth is the atmosphere (up to ~300 km). The thrust exerted per unit area on the earth's surface due to the column of air is called atmospheric pressure.
Value: Nearly $10^5 \text{ N m}^{-2}$ or 1 kgf/cm$^2$. We don't feel this enormous thrust because our blood pressure balances it.
Demonstration (Collapsing Tin Can Experiment):
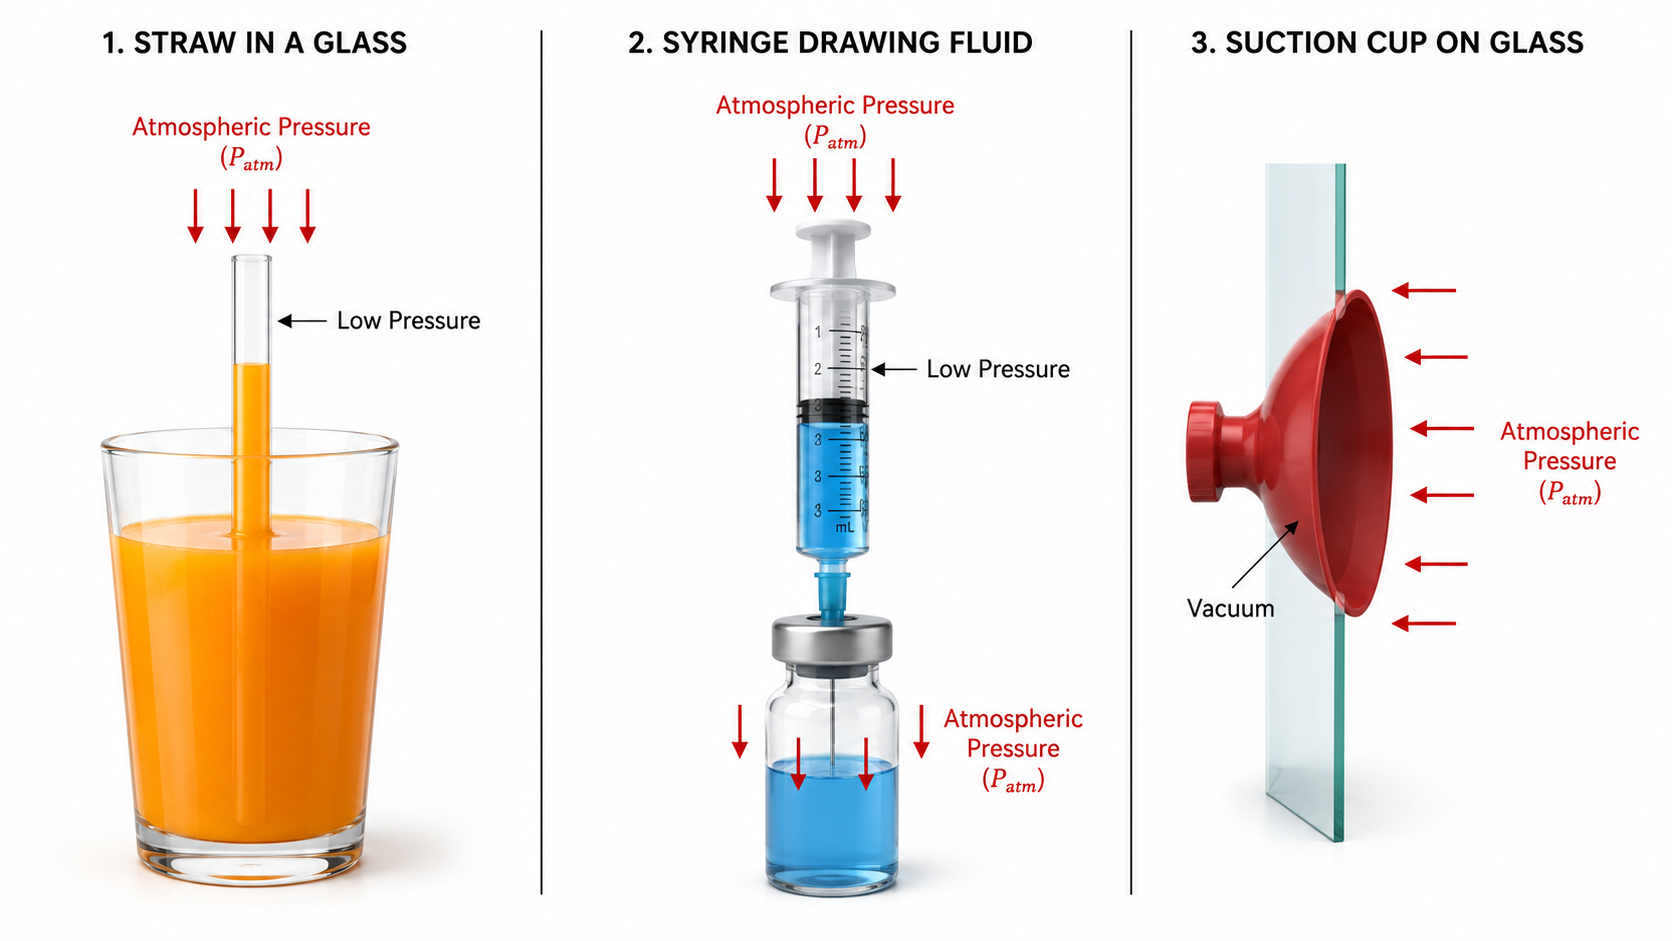
Diagram Description: A highly professional, 3D landscape academic diagram on a pure white (#ffffff) background. A triple-panel view. Panel 1: A transparent glass of orange juice with a clear straw, showing the liquid magically rising high up inside the straw. Panel 2: A medical syringe with its plunger pulled up, actively drawing blue fluid into the clear barrel from a small vial. Panel 3: A red rubber suction cup (sucker) firmly stuck flat against a vertical glass wall. In all panels, subtle downward red arrows indicate the invisible atmospheric pressure pushing the fluids up or the sucker in. Clean without clutter. IMPORTANT: You must include professional text labels. For all panels, label the downward/inward arrows as "Atmospheric Pressure (P_atm)". In the straw and syringe, label the empty space as "Low Pressure". For the suction cup, label the inner space as "Vacuum".
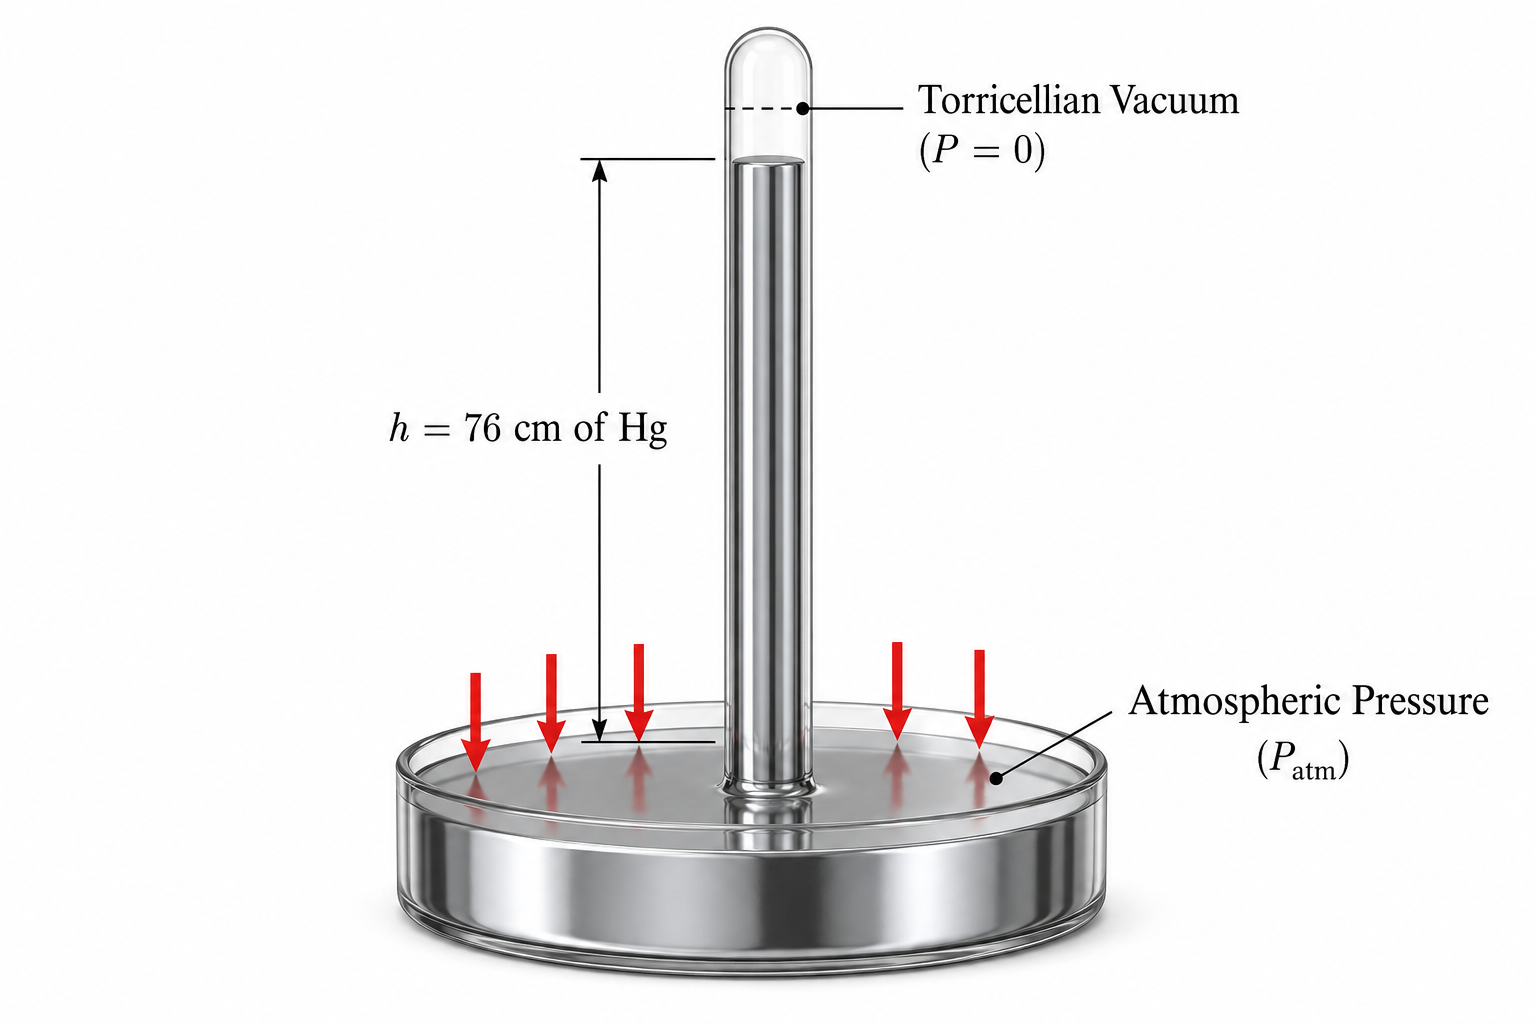
Diagram Description: A highly professional, 3D landscape academic diagram on a pure white (#ffffff) background. A Torricelli simple mercury barometer setup. A glass bowl (trough) containing highly reflective liquid silver mercury, with a long, thick transparent glass tube inverted into it. The mercury column is suspended high inside the tube. Downward red arrows forcefully press on the exposed mercury pool in the trough. A subtle dashed line marks the empty space at the very top of the sealed tube. Minimalist and academic. IMPORTANT: You must include precise scientific labels. Label the downward arrows on the trough as "Atmospheric Pressure (P_atm)". Label the mercury column height as "h = 76 cm of Hg". Label the empty top space as "Torricellian Vacuum (P = 0)".
An instrument used to measure atmospheric pressure is called a barometer.
Why is Mercury preferred over Water?
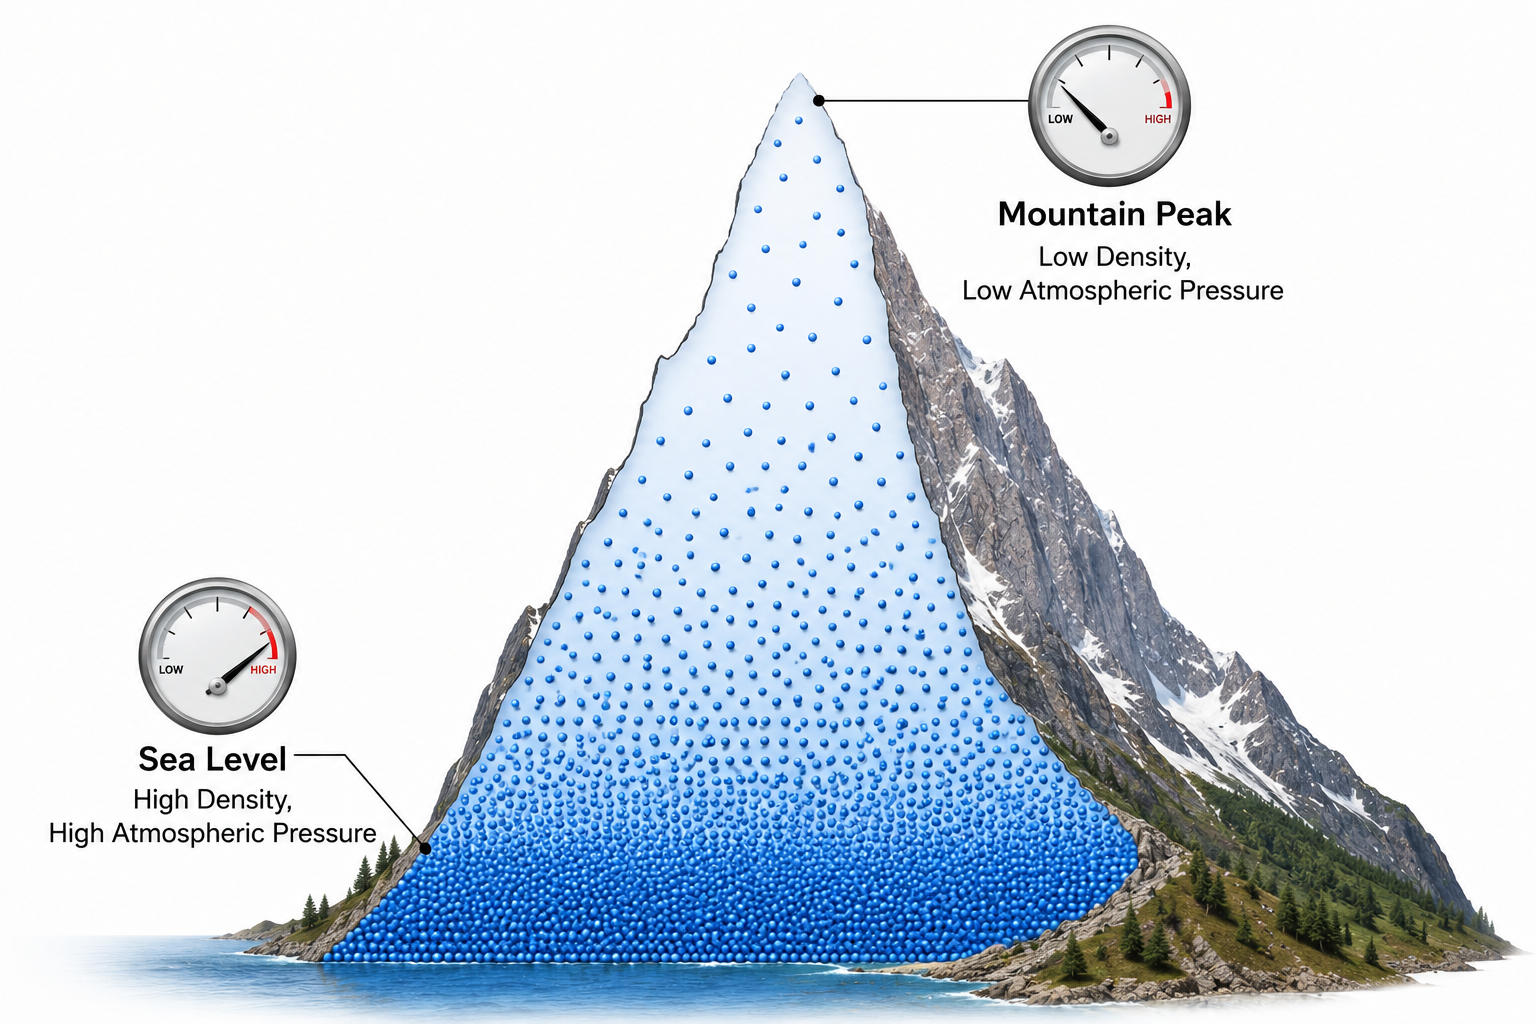
Diagram Description: A highly professional, 3D landscape academic diagram on a pure white (#ffffff) background. A cross-section illustration of a towering mountain peak reaching into the sky. Thousands of small blue dots represent air molecules: they are extremely densely packed at the bottom of the mountain (sea level) and progressively become very sparse and spread out near the mountain peak. Two simple pressure gauge dial icons are integrated into the scene: one reading high at the bottom, and one reading low at the summit. Clean. IMPORTANT: You must include professional text labels. Add a label at sea level reading "High Density, High Atmospheric Pressure". Add a label at the peak reading "Low Density, Low Atmospheric Pressure".
The atmospheric pressure decreases with altitude (non-linearly). At Mount Everest, it is only 30% of sea-level pressure.
Reasons:
Consequences of High Altitude:
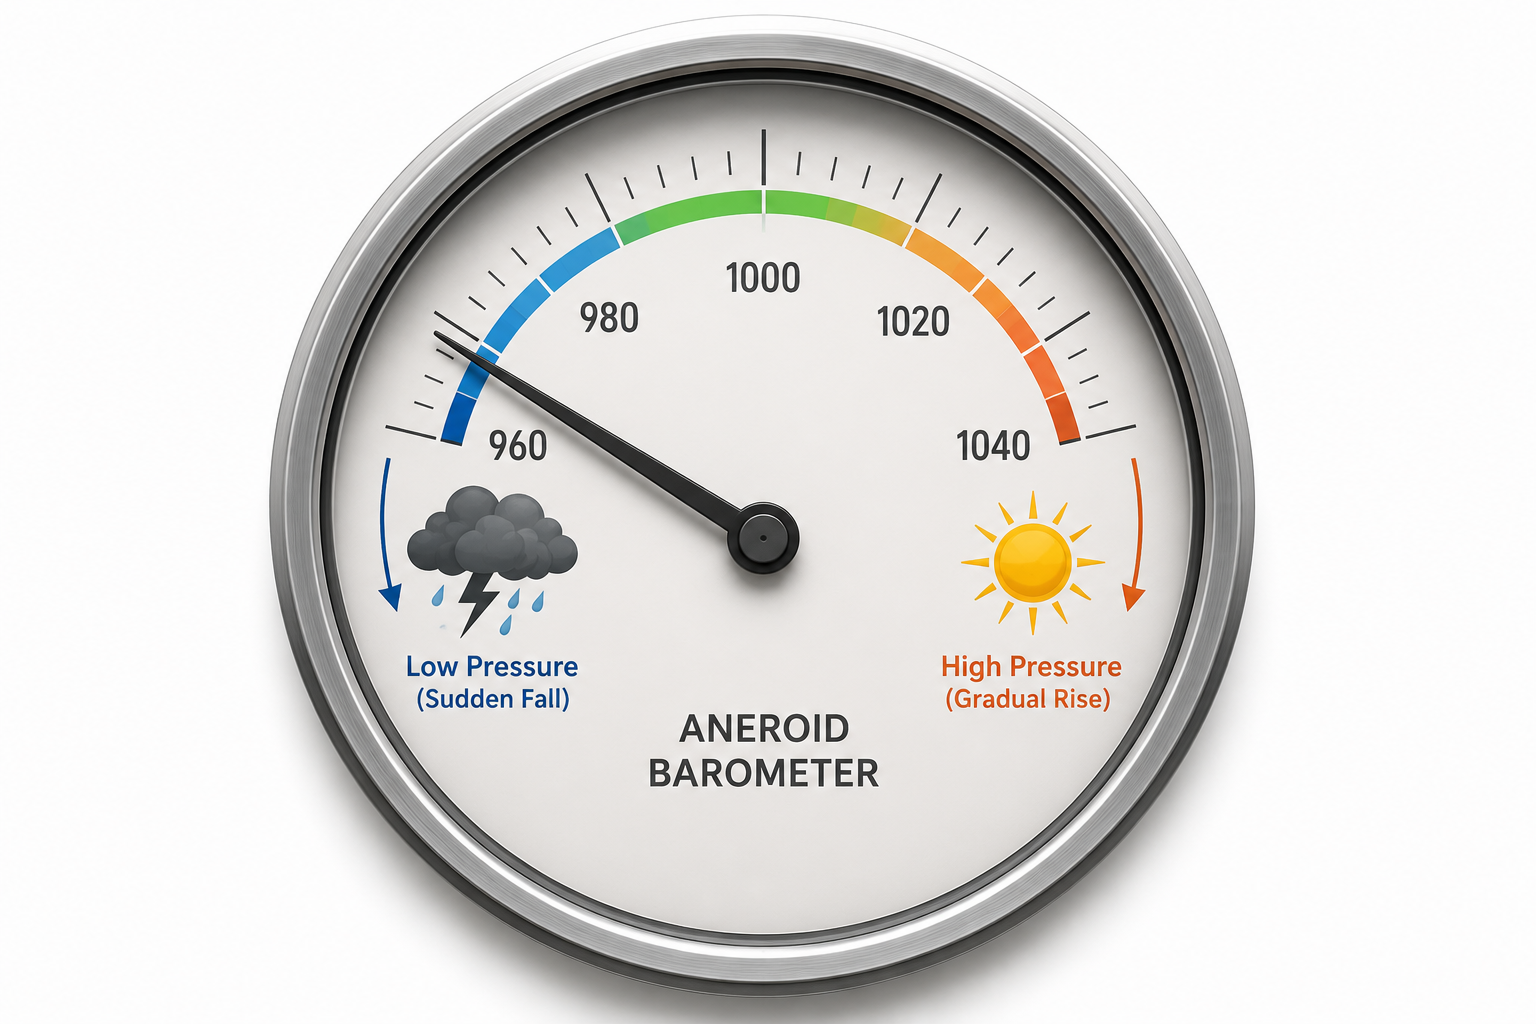
Diagram Description: A highly professional, 3D landscape academic diagram on a pure white (#ffffff) background. A sleek, modern aneroid barometer circular dial. The dial has a clean metallic needle pointing dynamically to a dark stormy cloud with lightning icon on the far left (indicating low pressure / sudden fall), transitioning to a bright yellow sun icon on the far right (indicating high pressure / dry weather). The design is minimalist, utilizing flat vector styling with sharp contrast. No text clutter, but MUST include professional text labels. Label the stormy side with "Low Pressure (Sudden Fall)" and the sunny side with "High Pressure (Gradual Rise)".
Weather Forecasting Rules:
Altimeter: An altimeter is a modified aneroid barometer used in aircraft. Since atmospheric pressure drops with height, the scale is calibrated directly in terms of altitude (height of ascent) instead of pressure.
Q. The atmospheric pressure at a place is 75 cm of Hg. Express it in $\text{N m}^{-2}$. (Density of Hg $= 13.6 \times 10^3 \text{ kg m}^{-3}$, $g = 9.8 \text{ m s}^{-2}$)
 VARDAAN COMET