Vardaan Learning Institute
Competency Based Assessment
Class: 8 (CBSE)
Subject: Mathematics
Max. Marks: 40
Name:
Date:
CASE-BASED QUESTIONS (4 Marks Each)
Case Study 1: The Charity Drive
Mr. Sharma is a social worker. He decides to donate $\frac{1}{3}$ of his monthly salary to an orphanage
and $\frac{1}{4}$ of his salary to a food bank. He keeps the remaining part for his personal expenses
and savings.
1. What fraction of his salary did he donate in total?
2. What fraction of his salary is left with him?
3. If his monthly salary is ₹60,000, find the exact amount he donated to the food
bank.
Case Study 2: The School Excursion
A school organized an excursion for Class 8 students. They booked different modes of transport. Half of
the students went by bus, one-fourth went by car, and the remaining 20 students went by a mini-van.
1. Let the total number of students be $x$. Write a linear equation representing this
situation.
2. Solve the equation to find the total number of students.
3. How many students went by bus?
Case Study 3: The Farm Land
A farmer has a field in the shape of a parallelogram ABCD. He measures angle A and finds it to be
$70^\circ$. He wants to fence the field and needs to know the other angles to place corner posts
correctly.
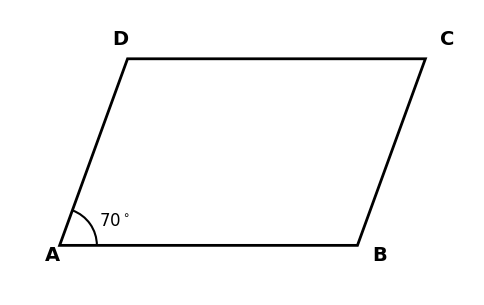
1. What is the measure of angle B? (State the property used)
2. What are the measures of angle C and angle D?
3. If the farmer decides to change the shape to a rectangle while keeping the
perimeter same, what will be the measure of angle A?
Case Study 4: Sports Selection
A survey was conducted in a school to find the favorite sport of Class 8 students. The data was
represented in a Pie Chart. The central angle for Cricket is $120^\circ$, for Football is $90^\circ$,
and the remaining is for Basketball.
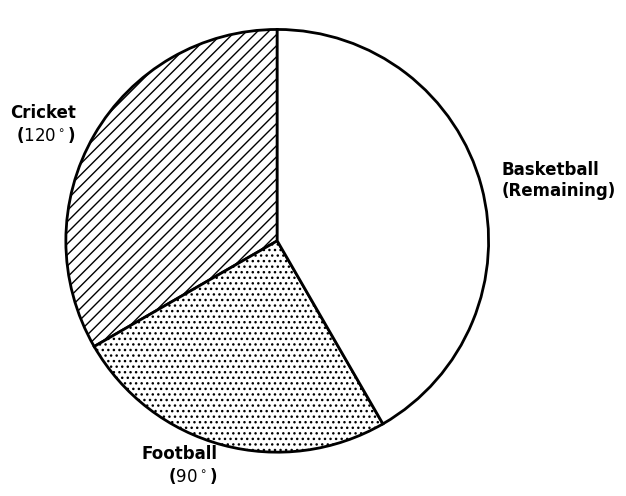
1. What fraction of students like Cricket?
2. Calculate the central angle for Basketball.
3. If there are 720 students in total, how many like Football?
Case Study 5: The Auditorium Seating
The school principal wants to arrange chairs in the auditorium for an assembly. He has 1764 chairs. He
wants to arrange them in such a way that the number of rows is equal to the number of chairs in each
row.
1. Which mathematical concept is used to find the number of rows?
2. Find the number of rows formed.
3. If he brings 100 more chairs, will he be able to form a perfect square arrangement?
Explain.
Case Study 6: The Festival Sale
During a Diwali sale, a shopkeeper marks a laptop at ₹40,000. He offers a discount of $10\%$ on the
marked price. However, a GST of $18\%$ is charged on the discounted price.
1. Calculate the discount amount.
2. What is the selling price of the laptop before tax?
3. Calculate the final bill amount the customer has to pay including GST.
Case Study 7: The Rectangular Park
The Residents' Welfare Association decides to build a rectangular park. The length of the park is 5
meters more than twice its breadth. Let the breadth be $b$ meters.
1. Write an algebraic expression for the length of the park.
2. Write the expression for the perimeter of the park.
3. If the breadth is 10m, what is the area of the park?
Case Study 8: The Water Tank
A community water tank is in the shape of a cylinder. The radius of the base is 7 meters and the height
is 10 meters. The tank needs to be painted on the curved surface, and then filled with water.
1. Calculate the Curved Surface Area (CSA) that needs painting. (Use $\pi =
\frac{22}{7}$)
2. Find the cost of painting the CSA at the rate of ₹20 per $m^2$.
3. How much water (in $m^3$) can the tank hold?
Case Study 9: The Micro-Organisms
In a biology lab, students are observing cells. The size of a plant cell is $0.00001275$ m and the size
of a red blood cell is $0.000007$ m.
1. Express the size of the plant cell in standard form.
2. Express the size of the red blood cell in standard form.
3. What is the total size if we place 100 plant cells side by side? (Express in
standard form).
Case Study 10: The Delivery Boy
A courier boy cycles from a town to a neighboring suburban area to deliver a parcel. The distance-time
graph shows his journey. He starts at 8:00 AM.
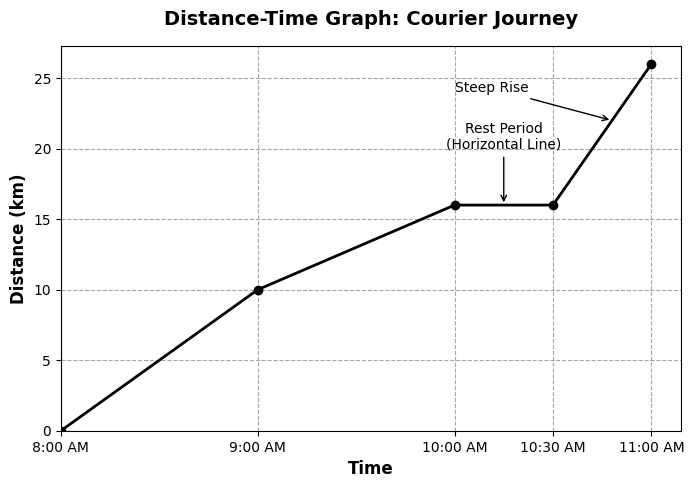
1. If the graph is a horizontal line between 10:00 AM and 10:30 AM, what does it
indicate?
2. If he covers 10km in the first hour, what was his speed?
3. The graph rises steeply. Does this mean he is traveling faster or slower?